Less, faster, and more
- If we compare 2020 to the 2008-2009 mortgage crisis, this time the market saw the fastest decline in history from all-time high, but ultimately the drop was smaller than a decade ago. The market has almost fully recovered over two months, while back in 2008 it took five years to get back to the level it was before the slump.
- Over the last five months, the U.S. Federal Reserve's balance sheet rose by $3 trln against $3.6 trln over six years during quantitative easing (QE) from November 2008 to October 2014. The current crisis is not financial, but economic, and the advanced countries have already pledged $16 trln in fiscal stimulus, or 12% of global GDP, an equivalent of 20% GDP in 2008, to spur recovery.
- This market is no longer bearish, it is bullish, and we expect sustainable growth, but it will be very volatile due to ongoing risks: escalating U.S. - China tensions, presidential elections in the U.S. and other factors that cannot be ignored. We forecast the S&P 500 to reach 3,250 pt by the year-end and 3,800 pt by the end of 2021. We project the RTS to reach 1 350 pt by the year-end and 1 600 pt by the end of 2021.
- We expect a V-shaped recovery of both the stock market and the economy. Therefore, we forecast a smaller decline, a faster rebound, and a robust growth going forward.
- We expect growth to be led by the countries that have injected more into their economies, namely the U.S., Europe (Germany, UK, and France) and Japan and, to a lesser extent, developing countries, especially in Europe.
- It doesn't matter that Russian equities are cheap with 60-65% discount to DM peers as it has always been, it’s the liquidity that matters and market beta which remains high.
- The Russian stock market will be primarily driven by the overall demand for risk and oil prices, so unlike 2019, the country will clearly lag behind its peers due to weak oil prices and limited liquidity. A spike in demand is expected during the dividend season, which has already begun and will gain momentum from mid-June to late August.
Major indices, $, YTD, %
-584.png)
Source: Bloomberg, ITI Capital
Comparative analysis of 2008 and 2020 crisis
- During the mortgage crisis, the S&P 500 market fell 58% from October 2007 and March 6, 2009. From 6 March to 10 June 2009, it recovered by 43%, retreated 8% from June 11 to July 14, 2009 and then grew by 16%.
- From July 15, 2009, the market saw a sustainable bullish trend with a decrease of no more than 5% until January 2010, when it suffered a 10% drop, followed by a three months growth, then there was a correction through August 2010 which was followed by a new growth cycle.
- Over the last 10 years, the market growth cycle averaged four months and correction cycle - one month. Overall, market took just under six years (from October 2007 to April 2013) to return to its pre-crisis highs, and then S&P 500 grew 115% over seven years, before the COVID-19 crisis that sent S&P 500 to the level of the late 2016 and made it erase three previous years of growth.
- From February 25 to March 19, 2020, the S&P 500 lost 35%, but in two months it rebounded 39% and is growing further reaching closer to pre-COVID19 levels. Ultimately, this time the correction was fast and lasted less than a month, as compared to the mortgage crisis, and market has recovered by 90% over two months.
S&P 500 in 2008 vs 2020
-555.png)
Source: Bloomberg, ITI Capital
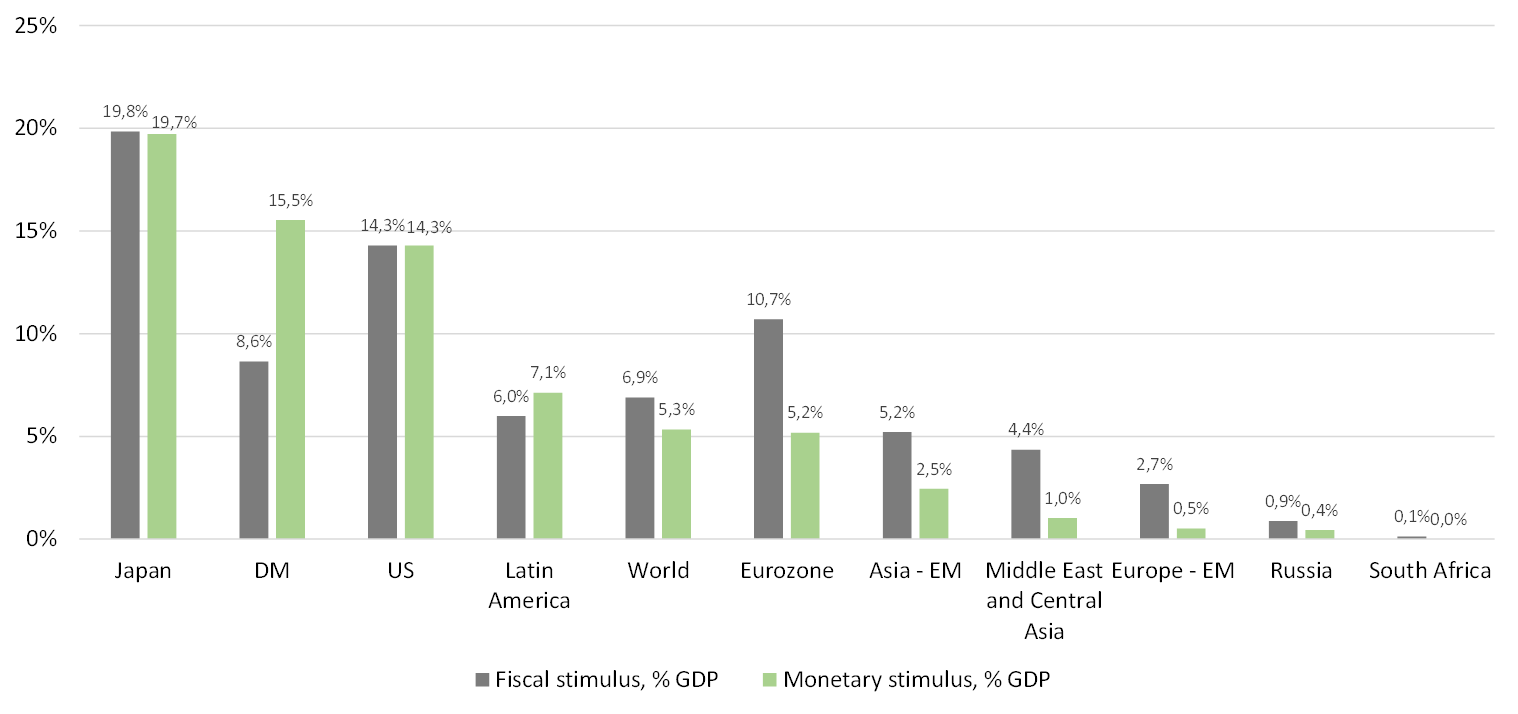
Global liquidity bazooka: $16 trln (12% of global GDP) over two months
- The main reason behind the recovery is that the crisis is economic, not financial. Even though economy rebounds more slowly, up to a year, there was no financial bubble and companies and banks approached the crisis with more solid and better quality assets. The economic crisis demand side driven has hit entire countries and major companies that had accumulated structural financial problems such as massive leverage and the high exposure to external FX-funding, such as Argentina, Ecuador, Turkey, South Africa, Nigeria, etc.
- Another more important factor is the unprecedented $16.2 trln (12% of GDP) stimulus package rolled out over two months. It includes $9.5 trln in fiscal stimulus measures and $6.7 trln in monetary stimulus. The relief package will ensure a fast recovery of the economy and assets’ value. The U.S. has unveiled the largest stimulus package with half of $6 trln meant for monetary stimulus, roughly the amount spent to fight the mortgage crisis.
- Last week the Japanese government approved a new economic stimulus package worth ¥117 trln ($1 trln), or 20% of GDP. This is the second set of measures to support business and the people, a third of which (¥32 trln) will be raised by issuing new government bonds (printing machine).
- The previous package of measures also amounted to ¥117 trln ($1 trln); therefore the total package amounted 40% of GDP, the world's largest by this ratio and the third-largest in money terms after the eurozone.
- Taking into account recently announced relief programmes, the EU's package may amount to $3 trln, or 16% of the block's GDP; the programme is designed for 2020-2027 and will be funded from the budget.
Global liquidity bazooka, % GDP
Source: Bloomberg, ITI Capital
Is correction looming?
- It’s a trillion-dollars question, as the S&P 500 drop by 4% wipes out $1 trln from the market. We believe that the market growth rate is unstable, although most of the assets are undervalued due to long lockdown.
- Secretary of State Michael Pompeo declared Hong Kong no longer autonomous from China. The U.S. may impose sanctions on China and end the former British colony’s trade preferences with the U.S. The House of Representatives has authorized sanctions against Chinese officials for abuses against Muslim minorities. Other bills in the pipeline would target Huawei Technologies Co., Chinese companies listed in the U.S. and banks that do business with Chinese officials who interfere in Hong Kong’s affairs. President Donald Trump has numerous policy options, from sanctions on officials and businesses to effectively treating Hong Kong no differently from the Chinese mainland. The worst- case scenarios have potentially massive implications, and China has vowed to strike back.
- We are not expecting a major correction, as Trump should put the market and economy under control before the elections, but massive turbulences may follow.
What to buy?
- Our global stock list has three sections: 1) Index funds (ETF), 2) Highly volatile and profitable ideas, and 3) The most oversold and reliable.
- The market has entered an active growth phase with no U-turns, it is no longer a bear market, but a bullish one, but the volatility will remain, as mentioned earlier.
- All stocks are ranked by upside potential for the next four months: the average annual return may reach 83% and amount up to 140% per annum in dollar terms for the top-10 stocks.
- Since March 23, the average return for shares from the list has already reached 45%, or 138% per annum in dollar terms.
The most oversold S&P 500 sectors by annual return in dollar terms:
1. Air carriers (200-300%)
2. Transport manufacturers (180-200%)
3. Clothing retailers and leisure/entertainment services providers (150-180%)
4. Other transport (150-180%)
5. Insurance (100-150%)
6. Finance (80-130%)
7. Oil and gas (50-80%)
For specific ideas, please contact myself or sales department.
p>


